| Persons | Institutes | Publications | Projects | Datasets | Maps | ||
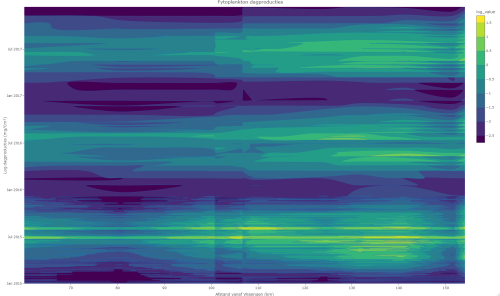
 Dagelijkse primaire productie in de Schelde 2010-2012.
Description Contourplot dagelijkse primaire productie (log getransformeerd gC/m²) in de periode 2015-2017 voor de Westerschelde en de Zeeschelde.
·
This work is licensed under a Creative Commons Attribution-NonCommercial-ShareAlike 4.0 International License
Click here to return to the thumbnails overview |
